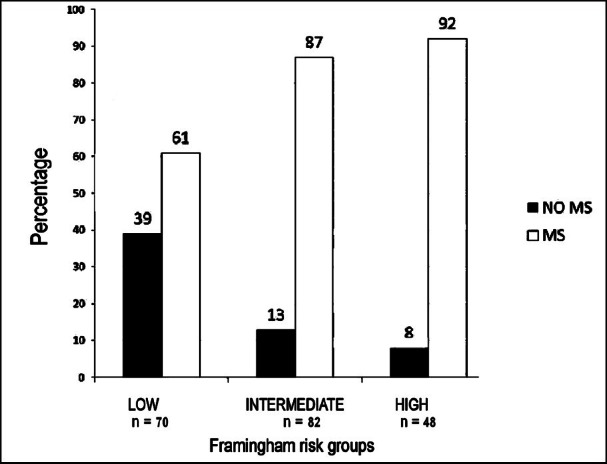
Fig. 1.

Proportion of patients in the low, intermediate and high FRS groups having MS (P value <0.05 for comparison between low and intermediate as well as low and high FRS groups).

Proportion of patients in the low, intermediate and high FRS groups having MS (P value <0.05 for comparison between low and intermediate as well as low and high FRS groups).