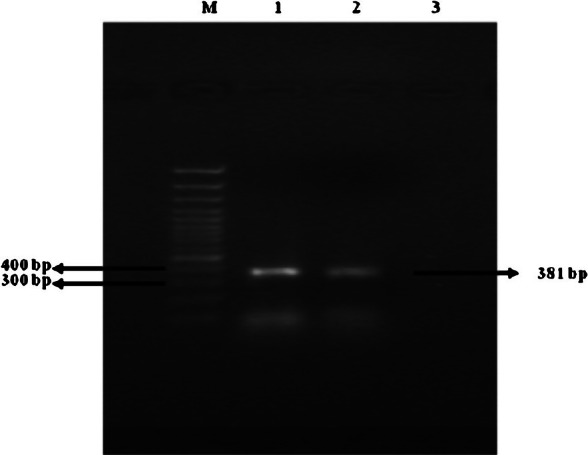
Fig. 4.

Agarose gel showing bands obtained by electrophoresis of PCR products from B. henselae using primers targeted at conserved bacterial citrate synthase gene sequence. Lane at left extreme is with marker DNA (100bp). Lanes 1 and 2 show B. henselae PCR product (381 bp); lane 3-negative control.
