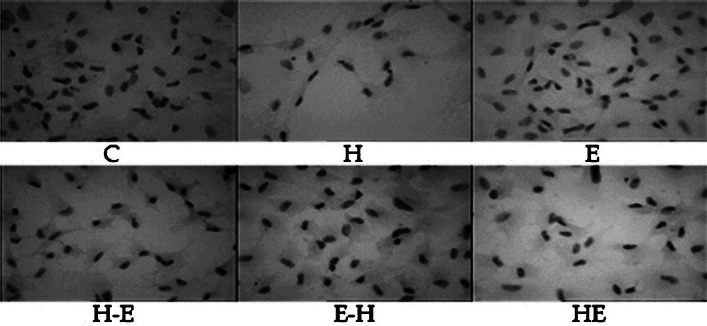
Fig. 1.

Haematoxylin-eosin stained goat lens epithelial cells (gLECs) of different treatment groups as viewed under light microscope with 10× objective. Groups; C = untreated cells, H = H2O2 treated, E = E2 treated, H-E = H2O2 treatment for the first 24 h followed by 24 h of E2 treatment, E-H = E2 treatment for first 24 h followed by H2O2 treatment, and HE = co-treatment of H2O2 and E2 for the first 24 h followed by MEM.
