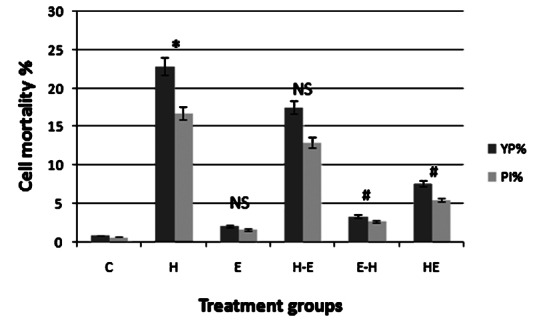
Fig. 4.

Cell mortality of gLECs in different treatment groups. Number of cells positive for YP and PI are expressed as a percentage of number of cells positive for Ho. Treatment group as defined in Fig. 1. Values are mean ± SE (n=3). NS, non significant. *P <0.001 compared with control; #P<0.001 compared with H.
