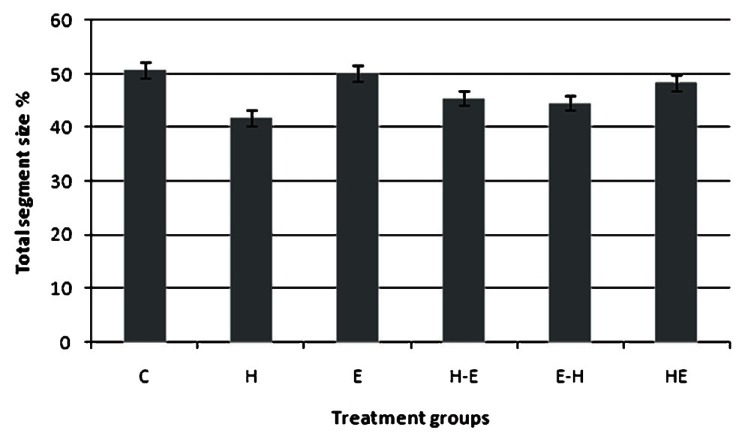
Fig. 6.

Western blot analysis of vimentin protein expression in gLECs after different treatments. The bands obtained were quantified using UN-SCAN-IT gel and the graph was plotted by comparing the per cent of total segment size in each treatment group. Groups as defined in Fig. 1. Values are mean ± SE (n=3).
