Figure 2.

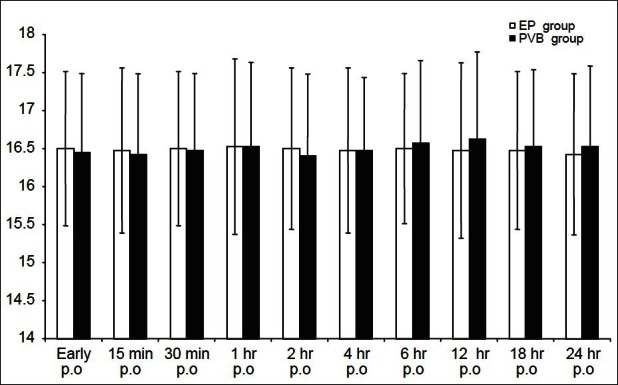
Post operative respiratory rate (RR) of the studied groups. White column (EP) n=40 and black column (PVB) n=40 PO=postoperative

Post operative respiratory rate (RR) of the studied groups. White column (EP) n=40 and black column (PVB) n=40 PO=postoperative