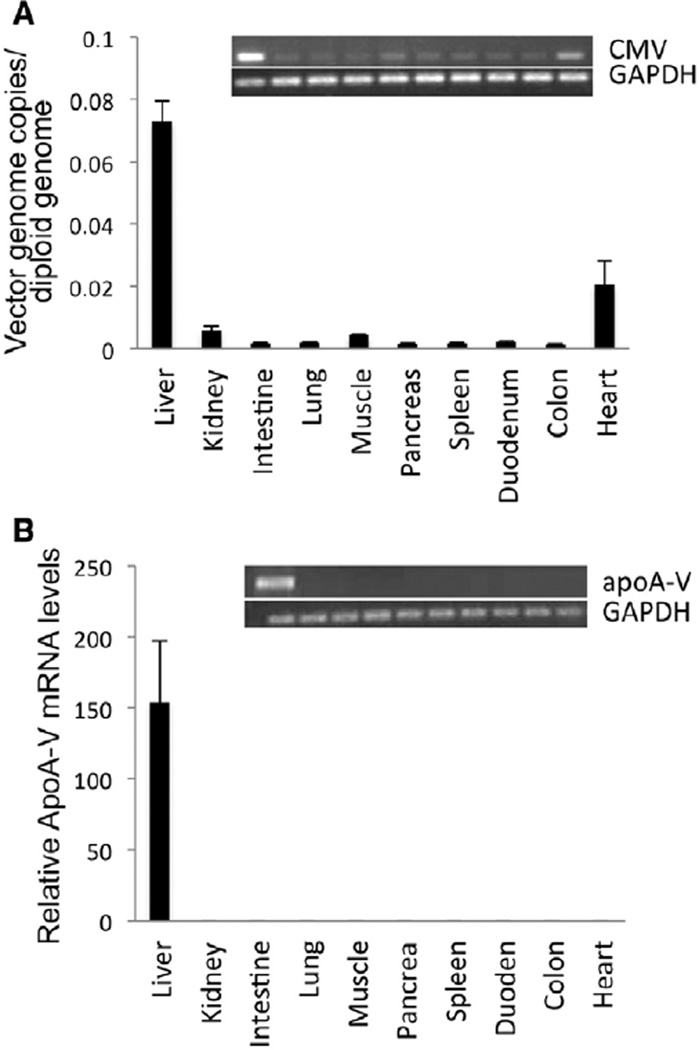
Figure 2.
Adeno-associated virus (AAV) 2/8 tissue distribution after injection. Eight weeks after gene transfer of 1×10¹² vg AAV2/8-apolipoprotein (apo) A-V into apoa5 (−/−) mice, indicated tissues were harvested and analyzed for (A) cytomegalovirus (CMV) promoter DNA. Inset shows polymerase chain reaction (PCR) amplification of CMV promoter region and glyceraldehyde-3-phosphate dehydrogenase (GAPDH) from genomic DNA from tissue extracts of mouse #4 (see Figure 1C). Lane assignments correspond to specific tissues, as indicated in the corresponding histogram. Histogram depicts quantitative PCR (qPCR) analysis of tissue extracts from 5 individual AAV2/8-apoA-V–transduced mice. Values were calculated as copies of CMV promoter DNA per diploid copy of mouse genomic DNA. B, Tissue distribution of apoA-V mRNA. Inset, PCR amplification of apoA-V cDNA and GAPDH cDNA from tissue extracts of mouse #4. Histogram depicts qPCR analysis of apoA-V mRNA relative to GAPDH in tissue extracts of 5 individual AAV2/8-apoA-V–transduced mice. Values are the mean±SEM (n=5).

