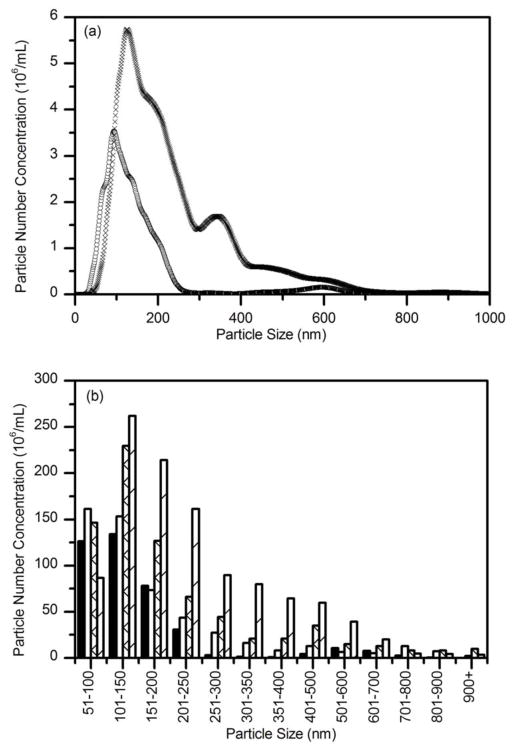
Figure 5.
Nanoparticle tracking analysis of Aβ aggregate growth kinetics. Aβ (28 μM) was prepared in PBSA from stock solutions and incubated at room temperature. (a) Size distribution of Aβ aggregates after 0.5 hours (○) and after 12 hours (▢). Distributions are shown at 1 nm resolution. (b) Size distributions of Aβ aggregates were binned and compared after 0.5 h (solid), 3.5 h (open), 7 h (cross) and 12 h (stripe) incubation.

