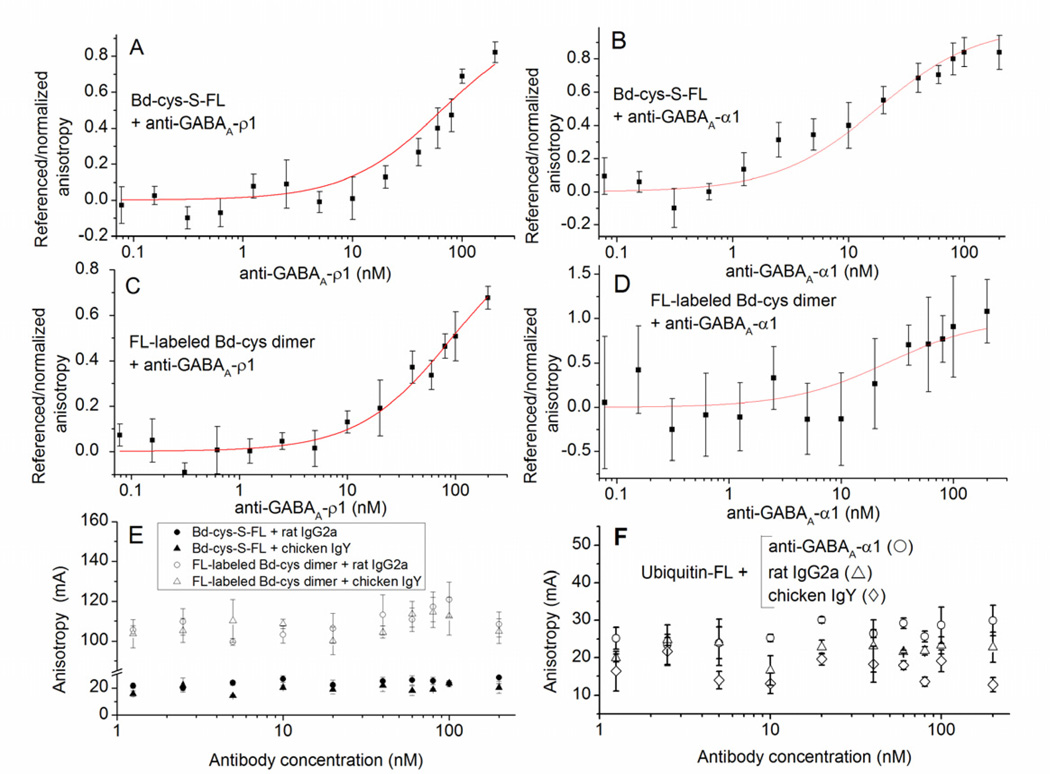
Fig. 5. Binding of Bd-cys preparations to anti-GABAA-subunit antibodies determined by FA.
The horizontal axis in each panel represents concentration of the tested antibody. (A–D) Referenced/normalized anisotropy in relation to antibody concentration (mean ± SD of values obtained in ≥ 2 experiments, each involving duplicate/triplicate samples). A: Bd-cys-S-FL with anti-GABAA-ρ1. Here and in (B–D), curves illustrate equation (1) fitted to the data. B: Bd-cys-S-FL with anti-GABAA-α1. C: FL-labeled Bd-cys dimer with anti-GABAA-ρ1. D: FL-labeled Bd-cys dimer with anti-GABAA-α1. (E–F) Anisotropy (mA) in relation to antibody concentration (mean ± SD of values obtained in one experiment, each involving triplicate samples). E: Anisotropy (mA) for Bd-cys preparations with control antibodies. Mixtures were: Bd-cys-S-FL with rat IgG2a (filled circles); Bd-cys-S-FL with chicken IgY (filled triangles); FL-labeled Bd-cys dimer with rat IgG2a (open circles); and FL-labeled Bd-cys dimer with chicken IgY (open triangles). F: Anisotropy (mA) for ubiquitin-FL with anti-GABAA-α1 (open circles), rat IgG2a (open triangles) and chicken IgY (open diamonds). An increase in anisotropy with antibody concentration occurred only when the antibody incubated with the Bd preparation was anti-GABAA-ρ1 or anti-GABAA-α1.

