
Fig. 2.
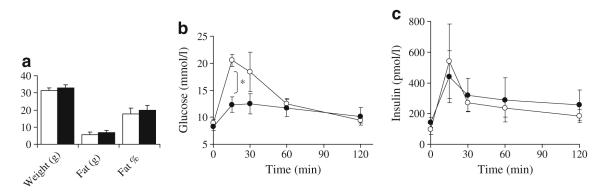
Mouse weight, fat (g) and per cent fat content after 4 weeks of mini-osmotic pump treatment while on HFD. b Glucose tolerance testing was performed after 4 weeks treatment. Fasted mice (16 h) were injected intraperitoneally with 1.5 mg/kg glucose. c Plasma insulin levels during the same glucose tolerance test. n=4 in each group, *p<0.05. White, saline control; black, exendin 4