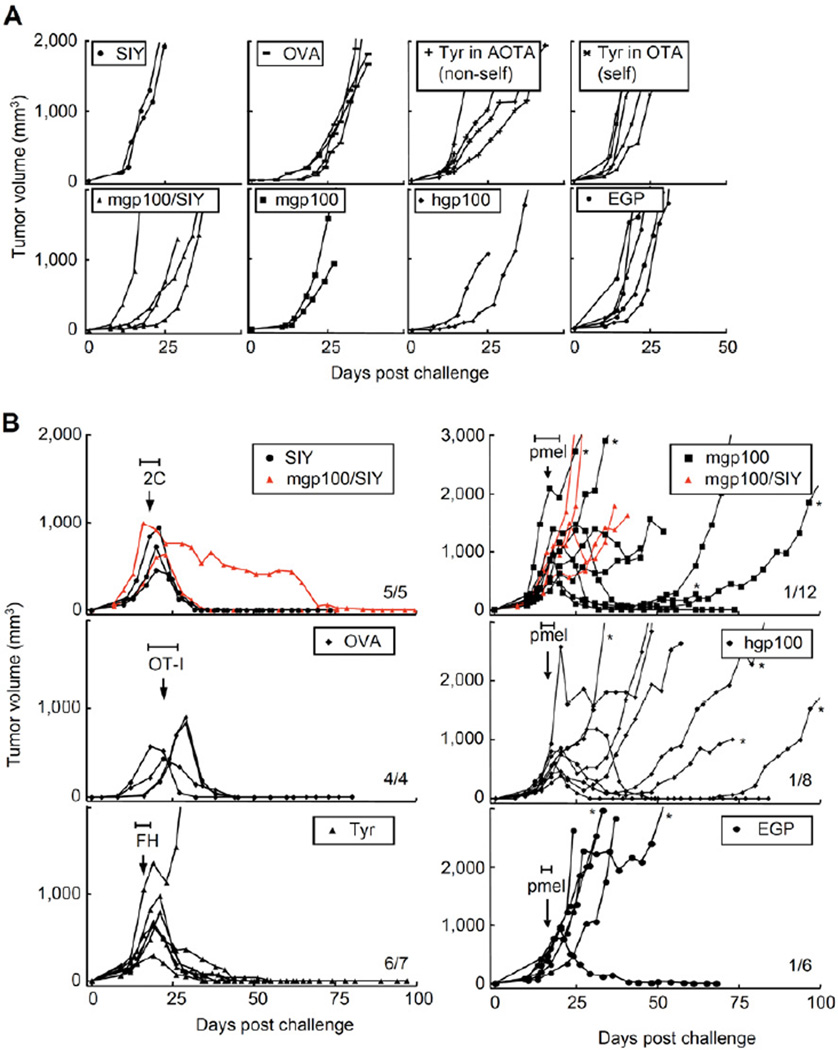
Figure 2. Targeting SIY, OVA257 or Tyr369 eradicated large tumors while targeting mgp10025, hgp10025 or EGP caused initial tumor regression but was followed by relapse.
(A) Cancer cell lines formed progressively growing tumors within one week. TCR-transgenic mice with irrelevant specificity were challenged s.c. with 2×10⁶ cancer cells. MC57-SIY, -mgp100, -mgp100/SIY, -hgp100 and -EGP were injected into OT-I mice; MC57-OVA grew in 2C mice and MC57-TyrHHD grew in AOTA (Tyr-deficient, non-self) and OTA (Tyr-positive, self). Graphs represent single mice in 11 experiments, listed as non-treated controls in Tables 1, S1 and S3. (B) At least 2 weeks after cancer cell injection, when tumors reached about 500 mm3, each mouse was treated once with cognate T cells (treatment between days 13 and 26, depending on tumor size, as indicated by the horizontal bars (H)). Average size of tumors at day of treatment: 2C: 720 mm3, ranging from 448 to 995 mm3; OT-I: 608 mm3, ranging from 440 to 715 mm3; FH: 517 mm3, ranging from 250 to 848 mm3; pmel, targeting mgp10025: 601 mm3, ranging from 325 to 980 mm3; targeting hgp10025: 470 mm3, ranging from 264 to 936 mm3; targeting EGP: 337 mm3, ranging from 180 to 600 mm3. MC57-TyrHHD was grown in OTA (self) and treated with FH T cells (self). The number of rejected tumors per number of tumors treated is indicated. Data are derived from 15 independent experiments, compiled in Tables 1 and S1. See also Figure S2.
* Tumors were isolated and analyzed for antigen expression (see Figure 3).

