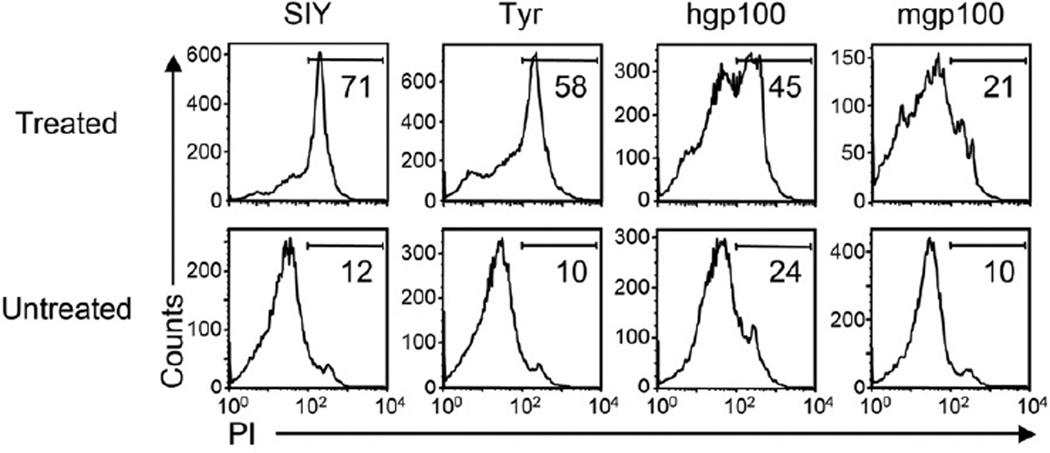
Figure 6. Death of stromal cells in T cell-treated SIY and Tyr369 expressing tumors.
MC57-SIY, -TyrHHD, -hgp100 and -mgp100 tumors were treated with 2C, AFH (non-self) or pmel T cells, respectively. Five days after adoptive transfer, single cell suspensions were generated from treated and untreated tumors and analyzed by flow cytometry. Histograms show CD11b+ T cells stained with propidium iodide (PI) to identify cell death. Numbers indicate the percentage of dead cells among CD11b+ cells. Data are representative for four independent experiments, with single mice per group.

