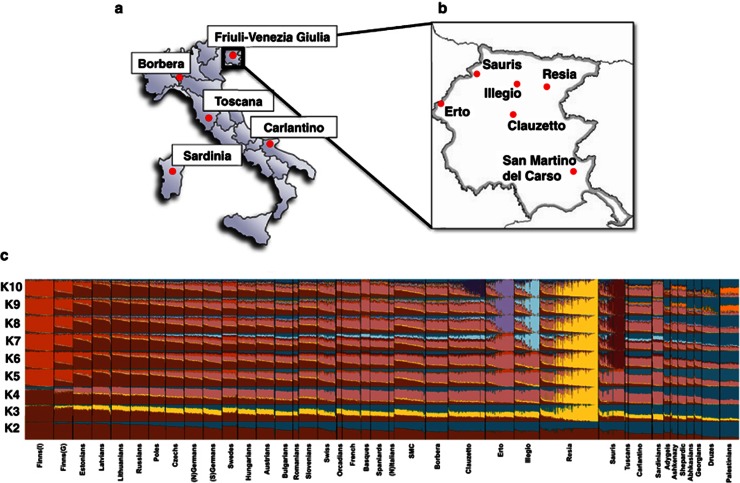
Figure 1.
Map showing approximate location of analyzed Italian samples and revealed population structure in analyzed populations. (a) A geographical map of Italy and shown are the approximate sampling regions. (b) A detailed geographical map of FVG and shown are the approximate location of the six villages. (c) Ancestry proportions of the studied 1008 individuals from 39 European and Near-Eastern populations (including the six FVG village populations) as revealed by the ADMIXTURE program29 with K=2 to K=10. A stacked column of the K proportions represents each individual, with fractions indicated on the y axis. From all non-FVG populations a subset of 24 randomly drawn individuals (if applicable) was used.

