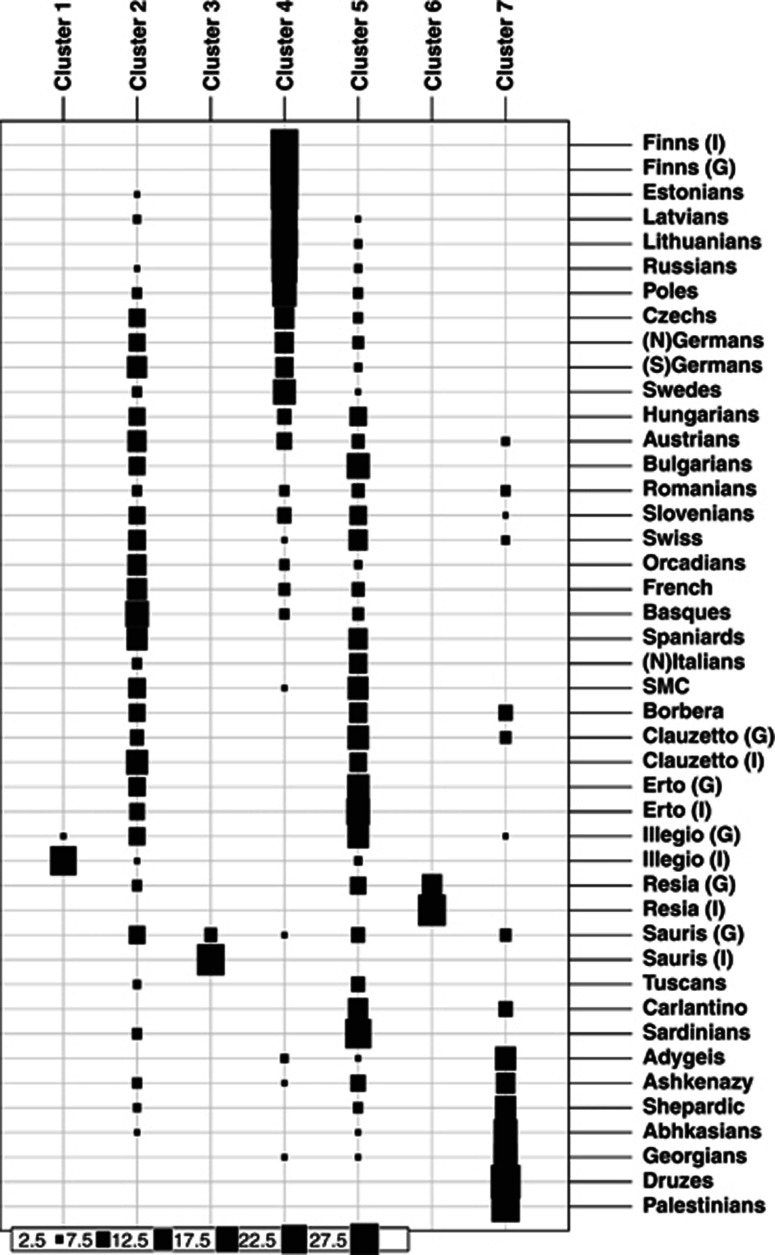
Figure 3.
Predicted cluster membership for each individual from DAPCs. Model optimum was found on K=7 and individuals are assigned to best-fitting cluster. The size of the rectangle scales with the number of assigned samples. In population names: N, northern; S, southern; I, a more homogeneous sub-population; G, a more general sub-population.

