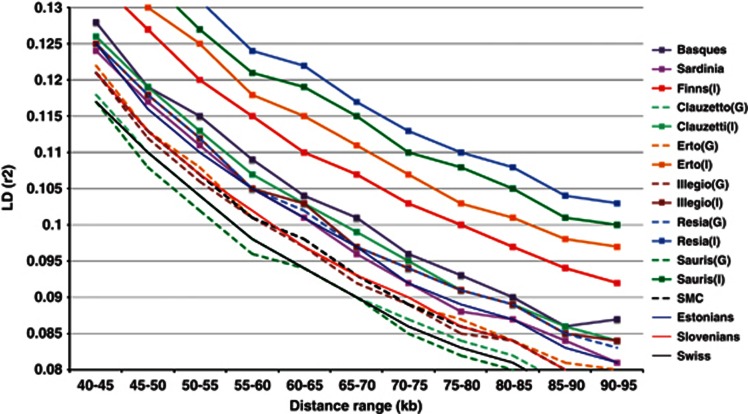
Figure 4.
Genome-wide LD length based on 145 000 SNPs. Each line represents the LD decay averaged across populations and sub-populations and LD (r2) between SNPs shown in 5 kb bins. Sub-populations drawn from same population have the same color coding. A dashed line represents the more general sub-populations and the solid line with rectangles represents the more homogeneous sub-populations respectively. A solid thin line represents the European reference populations (Estonians, Slovenians and Swiss). The LD extent in reference population isolates (Sardinians, French Basques and northern Finns) is also shown with a solid line with rectangles. In population names: I, a more homogeneous sub-population; G, a more general sub-population.

