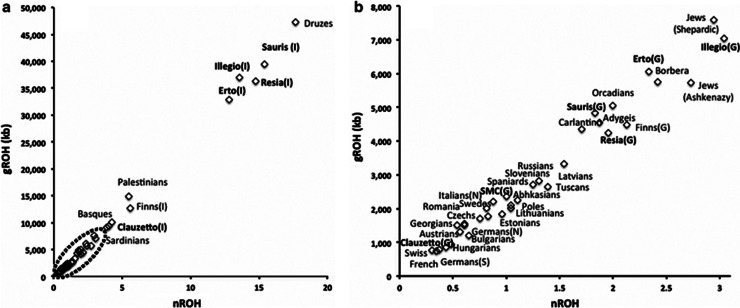
Figure 5.
The genomic runs of homozygosity (gROH) based on 145 000 SNPs. (a) Distribution of population mean homozygous segments and mean count of gROH>1.5 Mb per sample. (b) Zoom in view for the region indicated with a dashed ellipse on (a). FVG sub-populations are indicated in bold letters. In population names: I, a more homogeneous sub-population; G, a more general sub-population.

