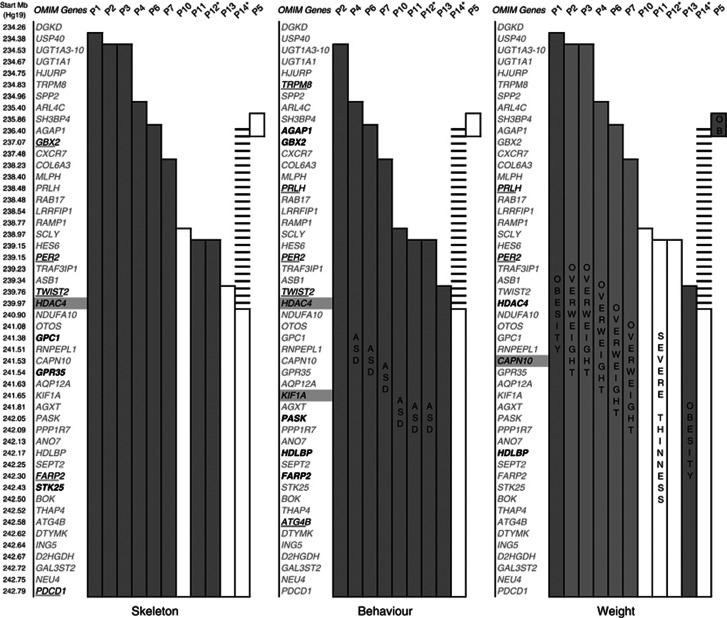
Figure 4.
Representation of genotype–phenotype correlations in patients with 2q37 deletions, on three physical maps named ‘skeleton', ‘behaviour' and ‘weight' when documented. Patients P8 and P9 were not included as their associated rearrangements may interfere in the phenotype (see Table 3). First column on the left: location of the genes (Hg 19). On each of the three maps the first column comprises the list of OMIM genes with candidate genes from the literature (bold), from Manteia (underlined) and both (highlighted). The columns represent the deleted genes in the patients; P5 has an interstitial deletion (last column). The columns for patients symptomatic for the concerned features are darkened. The hatched area indicates the duplicated region (P14). *Associated cytogenetic abnormality. OB, obesity.

