Figure 2.

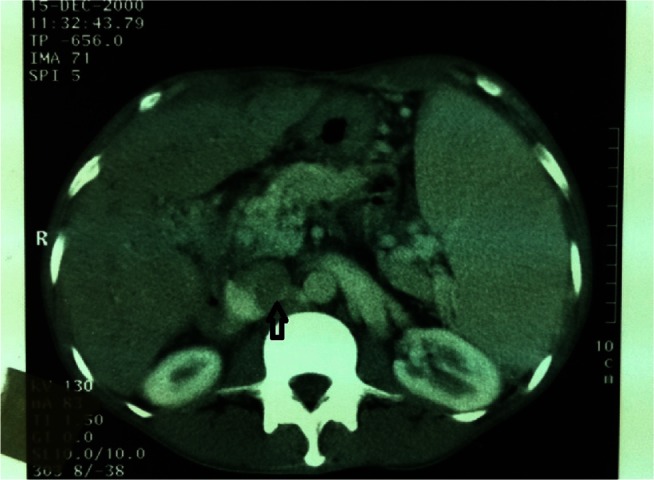
Contrast-enhanced computed tomography scan showing enlarged inferior vena cava with intraluminal clot (indicated by arrow), splenomegaly, and abnormally low enhancement of the liver.

Contrast-enhanced computed tomography scan showing enlarged inferior vena cava with intraluminal clot (indicated by arrow), splenomegaly, and abnormally low enhancement of the liver.