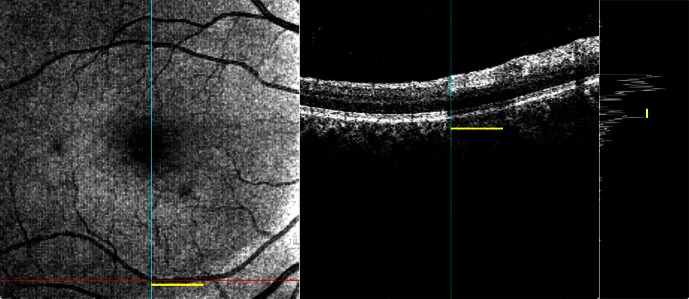
Figure 5.
Shadow effect of blood vessel on OCT image quality and signal strength. The horizontal red line on the en face image (left) indicates the position where the cross-sectional image (middle) was sampled, 2.61 mm away from the foveola. A dramatic drop of the signal strength can be observed at the positions where blood vessel lies (the yellow bar) on the cross-sectional image (middle) and the A-scan profile (left), which is sampled from the position of the cyan vertical line.

