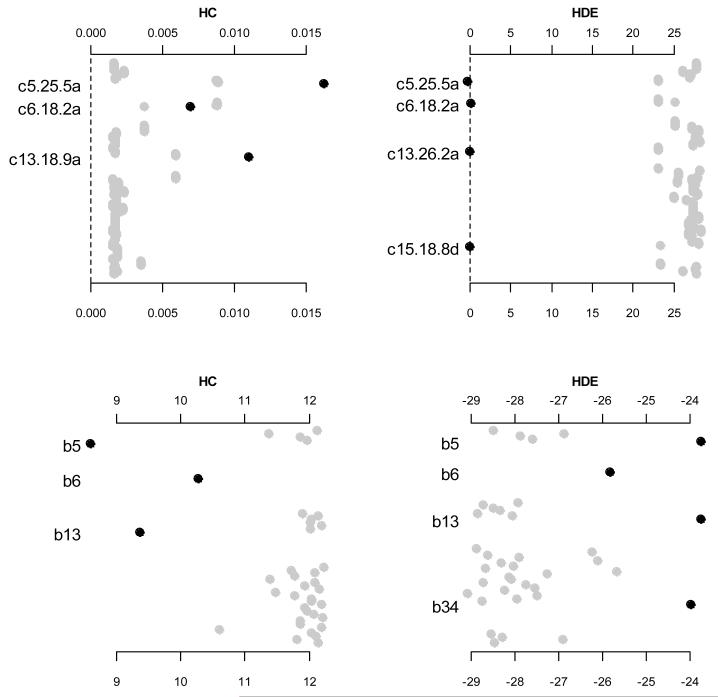
Figure 2.
Estimates of hyper-parameters of grouped variables for the two prior distributions, hierarchical Cauchy (HC) and hierarchical double-exponential (HDE). The top panels are the estimates of sj and log(sj), and the bottom panels are the estimates of log(bk), for hierarchical Cauchy and hierarchical double-exponential priors, respectively. Only terms corresponding to effects with p-value < 0.05 are labeled and blacked. The notation, e.g., c5.25.5a, indicates the additive predictor of the marker located at 25.5 cM on chromosome 5.

