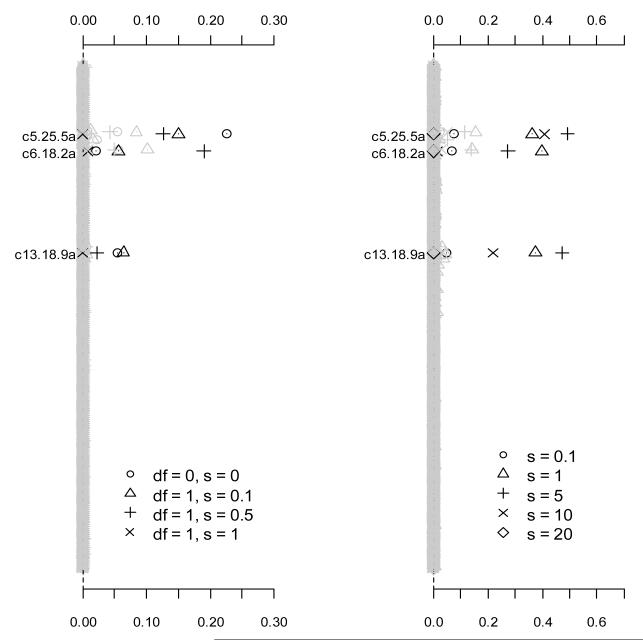
Figure 6.
Frequency of each effect estimated with p-value smaller than 0.05 over 1000 replicates using the prior distributions (the left panel) and (the right panel) with fixed values of sj. Only effects with non-zero simulated value are labeled and blacked. The notation, e.g., c5.25.5a, indicates the additive predictor of the marker located at 25.5 cM on chromosome 5.

