
Figure 3.
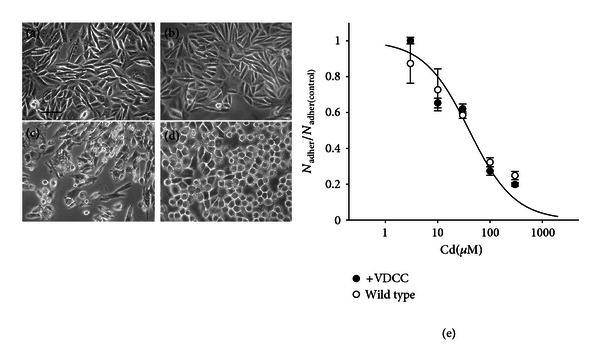
Effect of pulse treatment with Cd in CHOCα VDCC-expressing and wild-type CHO cells. Microphotographs of control (a, b) and Cd-treated (c, d) cells: (a, c) VDCC-expressing CHOCα cells and (b, d) wild-type CHO cells. Both cell types were incubated in 100 μM Cd for 60 minutes in the presence of 30 mM KCl. Pictures were taken 24 h after wash of the metal. Bar = 35 μM. The graph (e) shows the effect of a 30 min pulse treatment with Cd on cell adhesion, as a function of concentration. Trypan-blue excluding adherent cells were counted 24 h after wash of the metal. Points are average ± sem of 3 experiments in the same condition in CHOCα (filled circles) and wild-type CHO (empty circles) and were best fitted to the function. Nadher/Nadher(control) = 1/(1 + ([Cd]/ED50)), where Nadher/Nadher(control) is the number of adherent cells after Cd treatment normalized to the number of adherent cells in control culture; [Cd] is the concentration of Cd and ED50 is the concentration of Cd that causes detachment from the substrate of 50% of cells. The best fit yielded ED50 = 40 μM for CHOCα and 43 μM for wild-type CHO. The two curves are overlapped. In contrast with the different appearance, the two cell types were similarly affected by Cd treatment.