
Fig. 2.
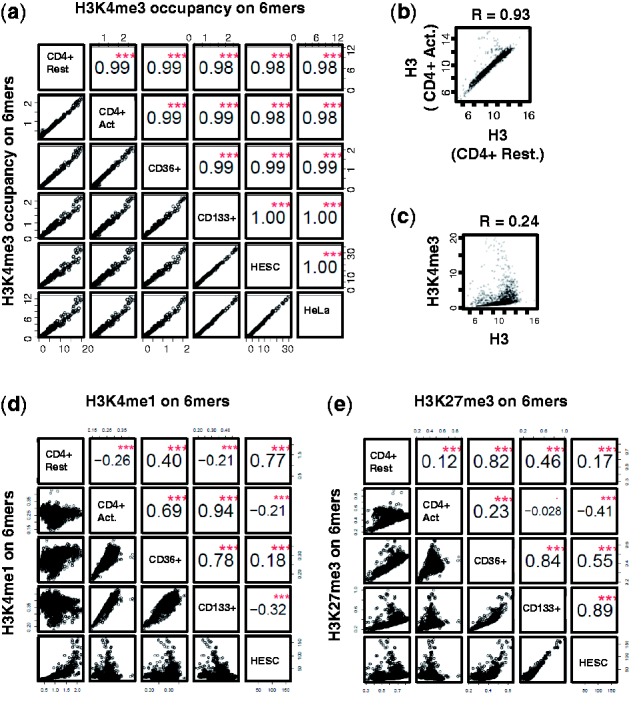
H3K4me3 shows consistent and distinct sequence specificity among various human cell types, whereas other modified nucleosomes do not. (a–e) The correlations of the 6mer specificities in H3K4me3 nucleosomes (a), in H3 nucleosomes (b), between H3K4me3 and H3 nucleosomes (c), in H3K4me1 nucleosomes (d) and in H3K27me3 nucleosomes (e). The nucleosome-bound DNAs were identified using the ChIP-seq data from various cell types: CD4 + T cells in resting state (CD4 + Rest), CD4 + T cells in activated state (CD4 + Act), CD36 + erythrocyte stem cell (CD36 + ), CD133 + , HESC and HeLa cells. The values in the squares represent correlation coefficients of 6mer sequence preference between two cell types. The red stars in a square signify that the correlation is highly significant, with the P-value close to 0. The vertical and horizontal axes represent the number of ChIP-seq reads covering the 6mer normalized by the number of 6mers in the human genome. Each point represents the enrichment of a 6mer in the ChIP-seq experiments in two cell types. The cell types on the x-axis and y-axis are marked on the main diagonal