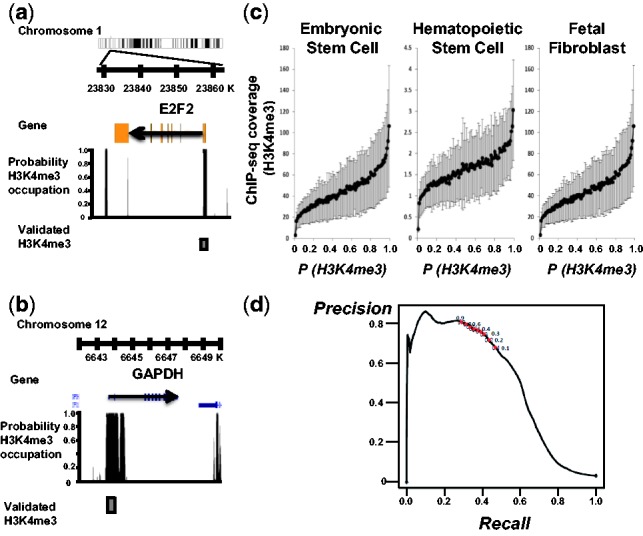
Fig. 4.

Computed probabilities of H3K4me3 occupation recapitulate in vivo occupancies of H3K4me3 across various cell types. (a and b) The 5′-end of E2F2 and GAPDH genes have been experimentally validated to have a very high level of H3K4me3 using western blot (Steward et al., 2006). Arrow indicates the direction of transcription. The level of black bar is the probability of H3K4me3 occupation at a base pair. A gray box represents the genomic region containing previously validated high-density H3K4me3 nucleosomes. (c) H3K4me3 ChIP-seq experimental occupancy is correlated with probability of H3K4me3 nucleosome occupation based on the human genome among cell types. The gray lines represent the 99% confidence interval of the mean ChIP-seq read occupancy. (d) Precision-recall analyses of P(H3K4me3 occupation). The dots mark cut-off probability of H3K4me3 occupation at 0.1–0.9 increased by 0.1
