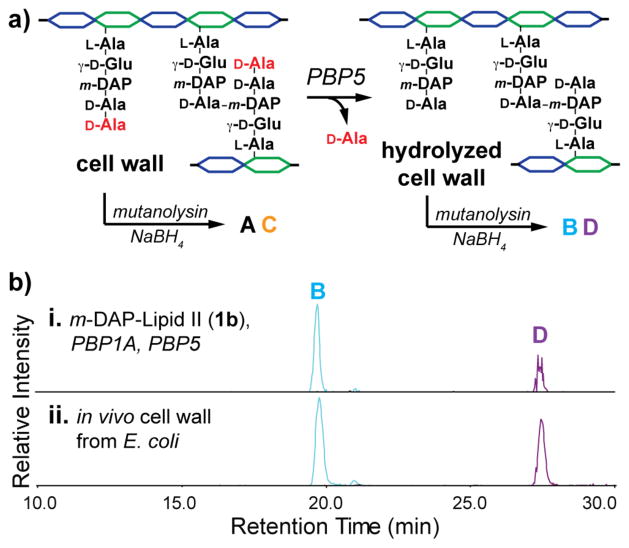
Figure 3.
The composition of PG produced in vitro resembles PG isolated from E. coli cells. (a) Schematic of experimental procedure for PG analysis shows that fragments A and C would result from degradation of PG synthesized in vitro, while B and D would result from prior hydrolysis of PG by E. coli PBP5,17d which liberates terminal D-Ala residues. (b) Treatment of PBP1A and 1b reactions with PBP5 produces hydrolysis fragments B and D (i) in proportions similar to those found in treated in vivo PG sample (ii). In vitro samples were prepared as before,14 except quenched PBP1A reactions were treated with PBP5 (0.8 μM) for 2 hr prior to analysis. See SI for details on cell wall isolation. (M+2H)/2 ions corresponding to fragments A–D were extracted from each chromatogram: A: 507.2; B: 471.7; C: 968.9; D: 933.4.

