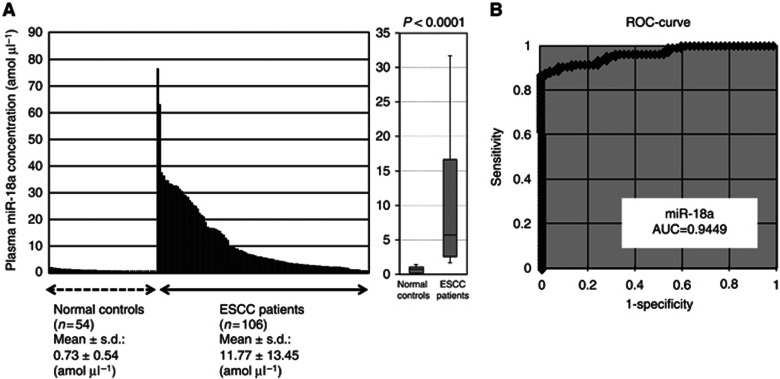
Figure 2.
(A) Plasma miR-18a concentrations in 106 consecutive ESCC patients and 54 healthy volunteers. Using a real-time RT–PCR assay, circulating miRNA, such as miR-18a, was detectable in all samples from 106 consecutive ESCC patients and 54 healthy volunteers. Differential expressions of plasma miR-18a with ESCC patients were compared with those of normal healthy volunteers by a waterfall plot. Concentrations of miR-18a were significantly higher in plasma from ESCC patients than those in healthy volunteers (P<0.0001). The upper and lower limits of the boxes and lines inside the boxes indicate the 75th and 25th percentiles and the median, respectively. Upper and lower horizontal bars denote the 90th and 10th percentiles. (B) Receiver-operating characteristic (ROC) curve analysis in the miR-18a assay for detecting ESCC patients. Receiver-operating characteristic analysis showed the greatest AUC of 0.9449 for miR-18a.

