Figure 1.
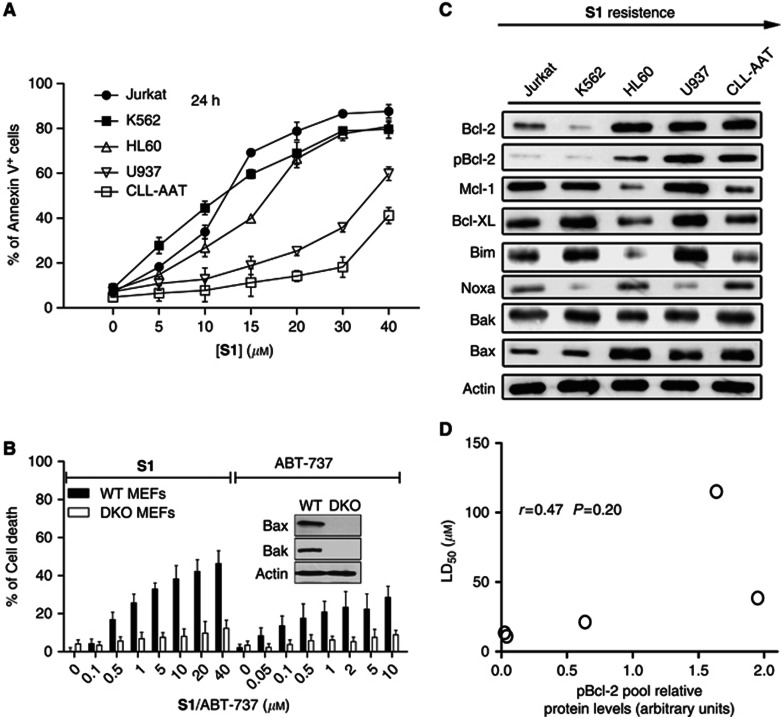
Individual Bcl-2 family protein expression levels did not predict the sensitivity to S1-induced apoptosis in leukaemic cell lines. (A) Leukaemic cell lines were cultured with increasing doses of S1 for 24 h, and then stained with Annexin V for flow cytometry analysis. The means of three independent experiments are shown. Data are the mean±s.e.m. (n=3). (B) S1 and ABT-737 induce apoptosis in WT but not Bax–/–Bak–/– (DKO) MEFs. Wild-type or Bax–/–Bak–/– MEFs were incubated for 48 h with S1 or ABT-737, and cell viability assessed by the 3-(4,5-dimethythiazol-2-yl)-2,5-diphenyl tetrazolium bromide (MTT) assay. Data are the mean±s.e.m. (n=3). (C) Immunoblot analysis of five leukaemia cell line lysates (100 μg of protein) with the indicated antibodies. Actin was used as a loading control. (D) pBcl-2 level did not predict LD50 of S1 well in leukaemia cell lines. Protein expression levels were defined by immunoblot analysis using the Kodak Carestream Molecular Imaging software and plotted against the LD50. The Spearman's rank correlation coefficient is indicated. Spearman's correlation (r) and P-values are also shown.

