
Figure 3.
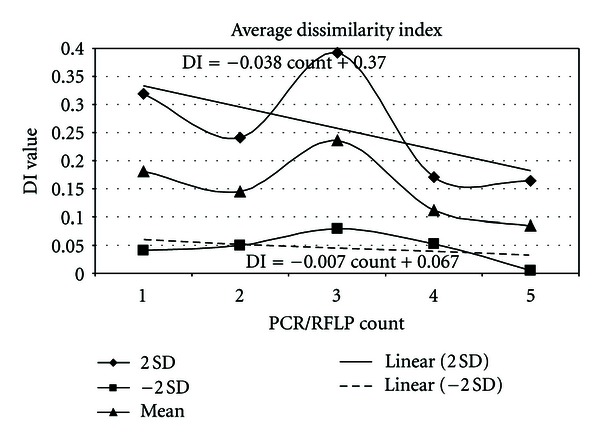
Estimation of the DI for each PCR/RFLP count. The mean and ±2 SD (standard deviations) were calculated from Nei and Li distances of the 28 pair-wise comparisons. The linear regression lines were calculated from ±2 SD values in order to indicate whether the genetic distances are converging or diverging.