Figure 3.

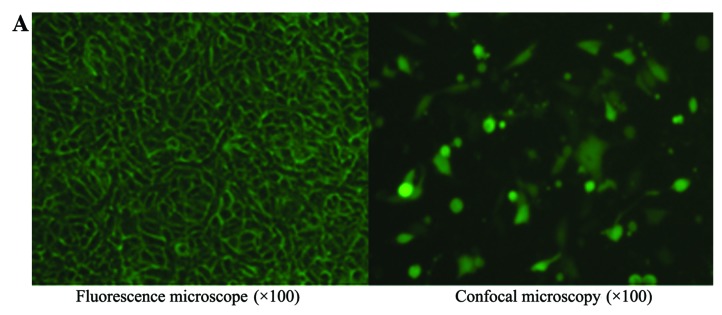
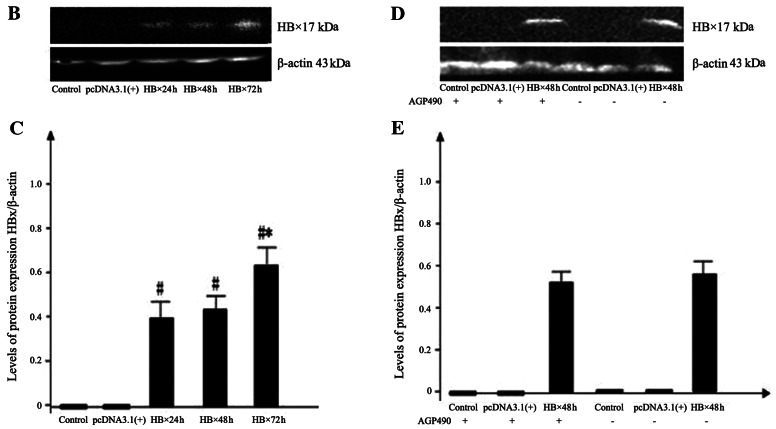
(A) Plasmid transfection efficiency as observed using confocal microscopy. (B) Western blot bands of HBx protein expression in the control group, the pc-DNA3.1(+) group, the HBx 24 h group, the HBx 48 h group and the HBx 72 h group. (C) Histogram of the relative expression of HBx protein in the control group, the pc-DNA3.1(+) group, the HBx 24 h group, the HBx 48 h group and the HBx 72 h group. (D) Western blot bands of HBx protein expression in the various groups with AG490, compared with the corresponding groups without AG490. (E) Histogram of the relative expression of HBx protein in the various groups with AG490, compared with the corresponding groups without AG490.

