
Figure 1.
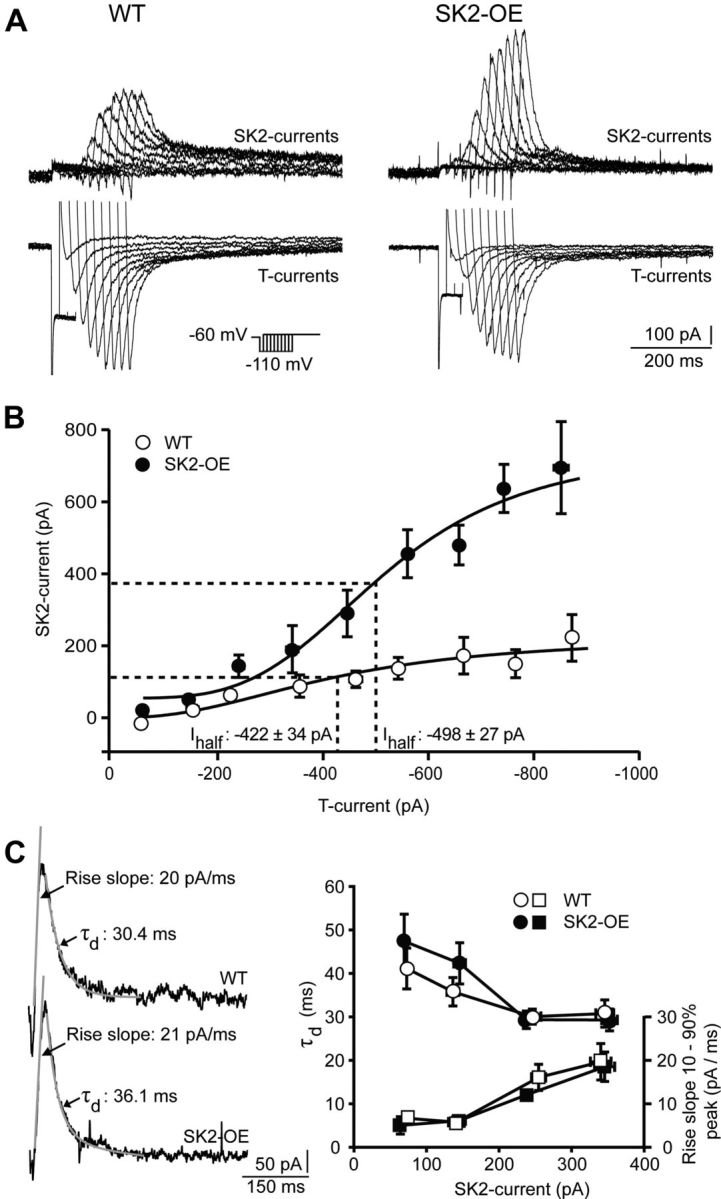
SK2 overexpression potentiates SK2-currents in nRt cells. A, Overlaid SK2-currents (top) and T-currents (bottom) from WT and SK2-OE nRt cells, elicited at the offset of hyperpolarizing steps to −110 mV lasting 20–180 ms (protocol in inset). SK2-currents shown here are apamin-sensitive currents obtained by digital subtraction. Current responses during hyperpolarization are truncated except for those lasting 20–60 ms. B, Dose–response relations between T- and SK2-currents, plotted for 100 pA bins of T-current amplitudes (WT: n = 11; SK2-OE: n = 13; p < 0.05 for all bins, except −300 to −399 pA). Half-maximal dose (Ihalf) was estimated from sigmoidal fit (black lines), with dashed lines highlighting Ihalf. SEs of T-currents are all < dot size. C, Example traces of SK2-currents from WT (top) and SK2-OE mice (bottom) showing linear fit of the rise slope for 10–90% peak and mono-exponential fit to determine decay time constant (τd) (gray overlaid traces indicated by arrows). Rise slope (squares, right axis) and τd (dots, left axis) across the range of SK2-current amplitudes generated in both genotypes (WT: n = 11; SK2-OE: n = 13; p > 0.05) are shown to the right.