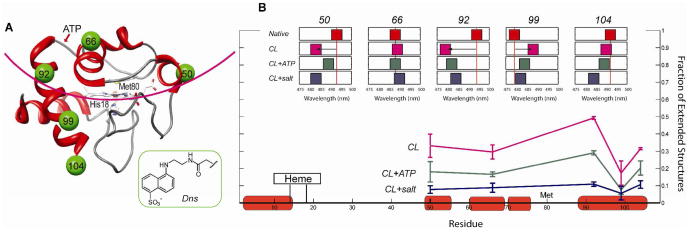
Figure 1.
(A) Structure of the native horse heart cyt c showing the labeled positions and the major ATP binding site (S1); inset –the Dns label. The arc line shows liposome binding surface suggested by results of this study. (B) Dns emission maxima (top) and fractions of E (r≥30 Å) species from TR-FRET (bottom) of five variants (3 μM) in a 25 mM HEPES buffer at pH 7.4; with CL liposomes (50 mol% CL, 750 μM total lipid); with CL liposomes and 10 mM ATP; with CL liposomes and 86 mM salt.

