
Figure 1.
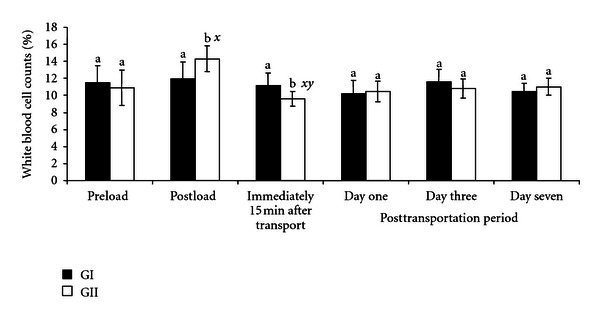
Changes in white blood cells counts (%) in GI and GII goats pre- and post-transportation. a, b = Bars with different alphabets are significantly (P < .05) different. x = P < .05 for pre-load; y = P < .05 for postload; z = P < .05 for immediately after transportation; k = P < .05 for one day after transportation. Pre- and postload, n = 10, posttransportation period, n = 20.