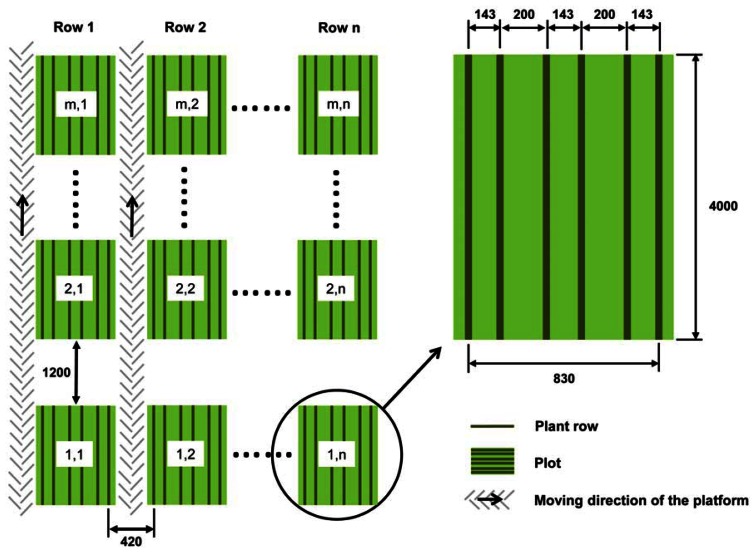
Figure 6.
General design of the field trials and moving direction of the platform, the interspaces between the plots and the dimensions of one single yield trial plot. All dimensions are specified in mm, n denotes the number of rows (2011: n = 48; 2012: n = 24) and m the number of plots per row (2011: m = 14; 2012: m = 25).

