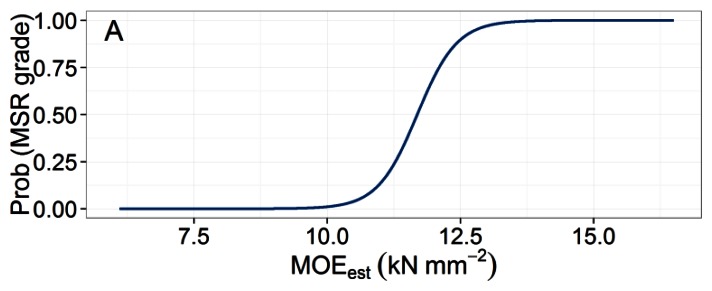
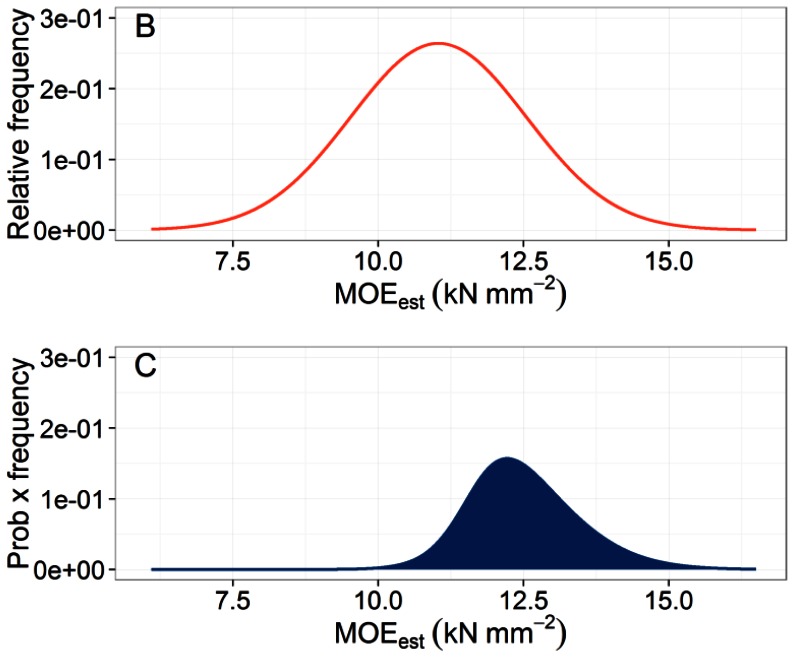
Figure 5.
(A) Proportion of boards meeting the requirements of the 2400Fb-2.0E MSR grade for a given value of MOEest assigned to a tree using the ST-300. (B) Relative frequency distribution of MOEest values. (C) Probability of meeting grade requirements multiplied by normal relative frequency distribution. The integral of the resulting curve provides a stand-level pass rate prediction for the specified MSR grade.


