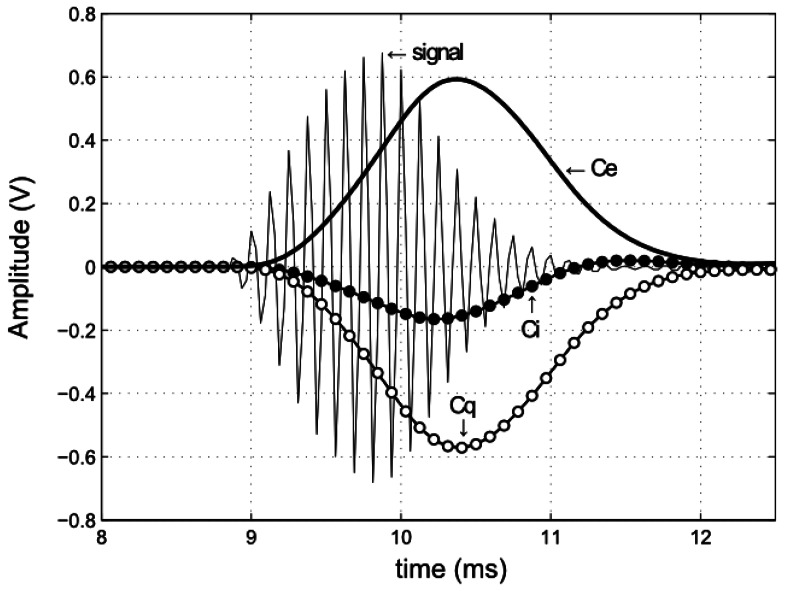
Figure 6.
Reception of an ultrasonic pulse emitted by a transmitter node located at a distance of 3 m from the receiver node. The thin continuous line represents the received sampled signal using a sampling frequency of Fs = 32.00 kHz (M = 3). The curves of filled and empty points correspond respectively to the in-phase (Ci) and quadrature (Cq) components obtained at the output of the matched filter. Finally, the thick continuous line represents the signal envelope (Ce).

