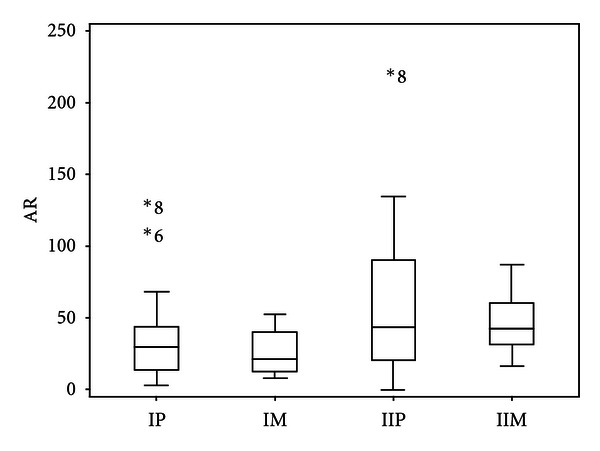
Figure 2.

Box- and-whiskers plots of the distribution of the total initial AR percentages for psychrotrophs (P) and mesophiles (M). The AR values correspond to the two AB concentrations (I = 4 × MIC for G, C, L, and 2 × MIC for TS; II = MIC). Outliers are indicated under their sample number.
