
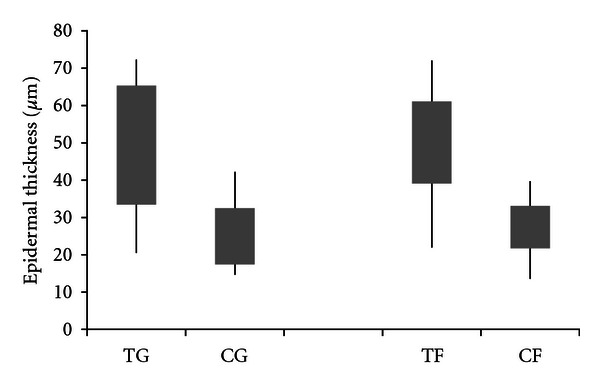
Figure 4.
Epidermal thickness in CMHA-S gel-(TG) and film-(TF) treated wounds versus untreated controls (CG and CF, resp.). Bars represent 95% confidence intervals of the means; lines represent the range of values obtained.
Official websites use .gov
A
.gov website belongs to an official
government organization in the United States.
Secure .gov websites use HTTPS
A lock (
) or https:// means you've safely
connected to the .gov website. Share sensitive
information only on official, secure websites.
Epidermal thickness in CMHA-S gel-(TG) and film-(TF) treated wounds versus untreated controls (CG and CF, resp.). Bars represent 95% confidence intervals of the means; lines represent the range of values obtained.