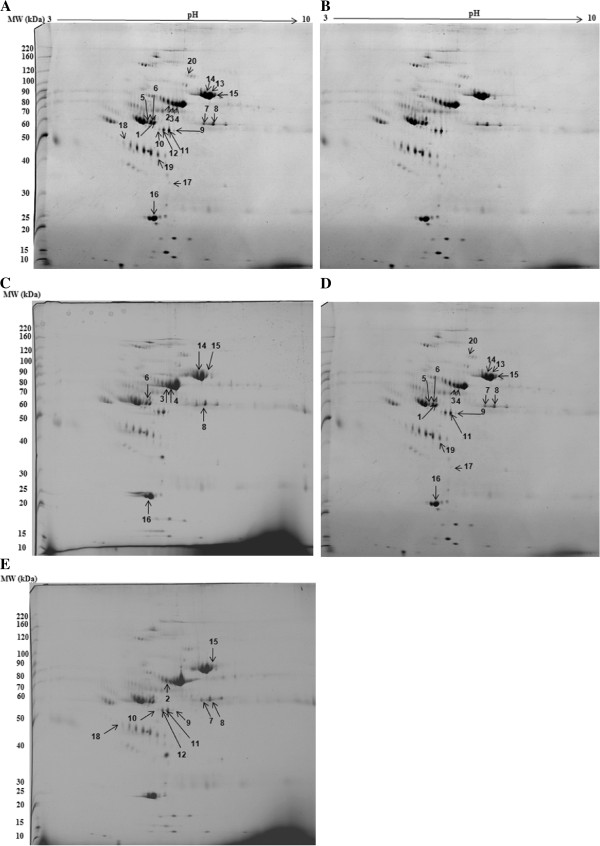
Figure 1.
Images from the 2D gels obtained in this work. (A) 2-DE gel image with plasma proteins of control (time zero, fresh plasma samples); (B-E) 2-DE gel images corresponding to the plasma samples stored at -80°C, -20°C, +4°C and room temperature respectively. The plasma was separated on 2-DE gels and visualized by Coomassie blue staining. Proteins undergoing a significant variation in abundance (>2-fold change) are numbered and indicated by arrows. The molecular weights (MW) and pI scales are indicated. Each gel is representative of three independent replicates.

