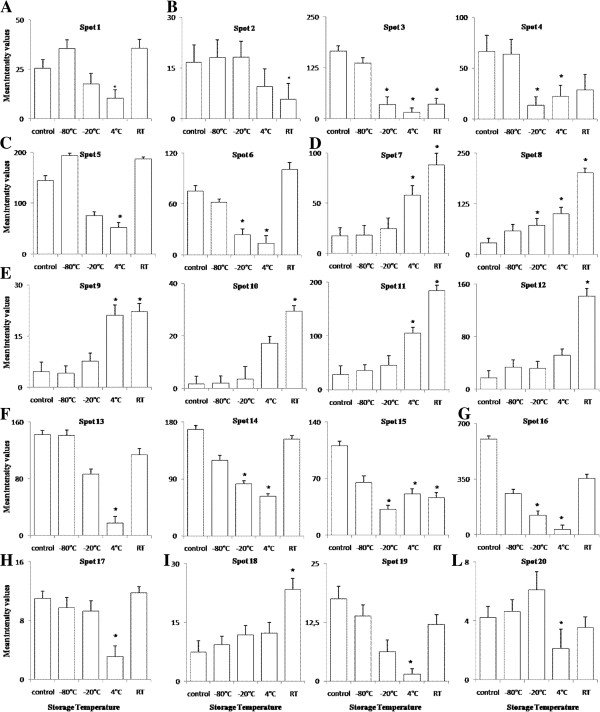
Figure 2.
Protein patterns showing significant changes (>2-fold) under different storage temperature with respect to time zero. The letters A-L represent the protein spots that showed statistically significant (p ≤ 0.05) change from control (time zero, fresh plasma samples): (A) vitamin D-binding protein; (B) serum albumin; (C) alpha-1-antitrypsin; (D) fibrinogen beta chain; (E) fibrinogen gamma chain; (F) serotransferrin; (G) apolipoprotein A-I; (H) apolipoprotein-E; (I) haptoglobin; (L) Complement factor B. The data represent the mean intensity values (±SD) from three replicates at each temperature. The bars with an asterisk indicate significant difference (p ≤ 0.05) with respect to the group “time zero”.

