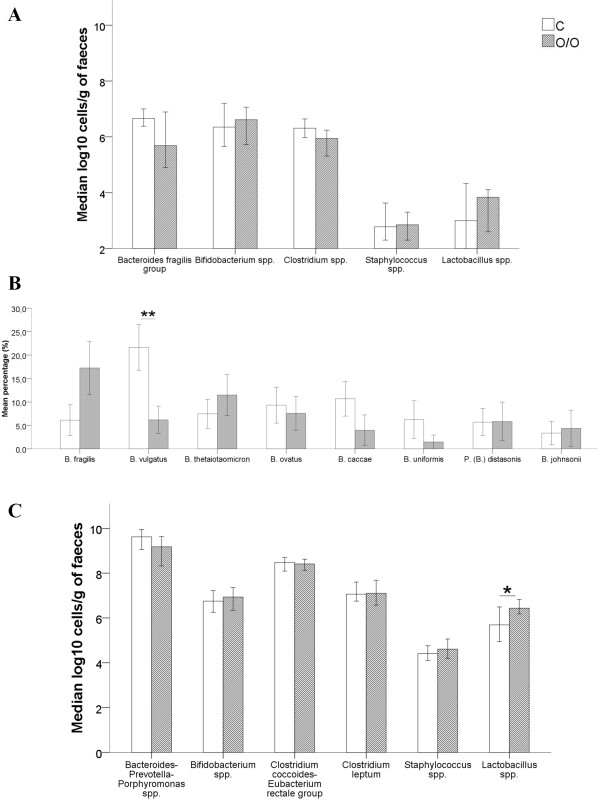
Figure 1.
Differences in bacterial genera between O/O and C group. A: Differences in bacterial genera between O/O and C detected by quantitative plating. B: Differences in relative proportions of Bacteroides fragilis group species between O/O and C detected by MALDI-TOF MS. C: Differences in bacterial genera between O/O and C detected by qPCR. Data of quantitative plating and qPCR are expressed as mean log10 cells/g of faeces. Data of MALDI-TOF MS are reported in percentages (%). O/O: obese group; C: control group. Error bars 95% CI. **p = 0.004. *p = 0.04.

