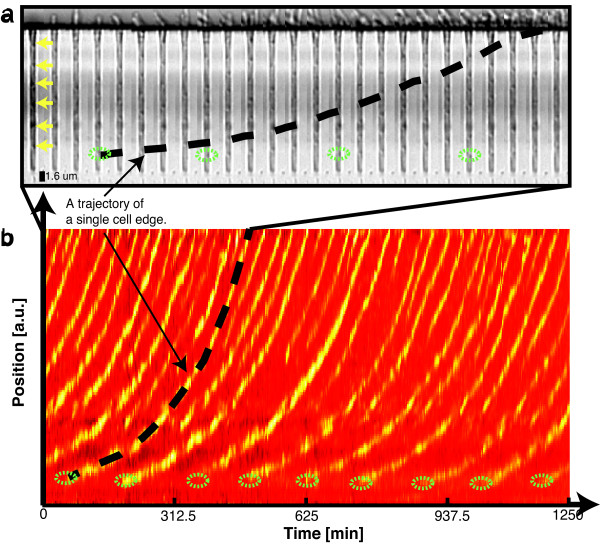
Figure 10.
A montage (a) and kymograph (b) of E. coli growing in the microfluidic device. (a) A montage (interval of 25 minutes) made of a single growth channel using the ImageJ software package. The yellow arrows in the montage indicate the edges of the different bacterial cells which corresponds to the yellow traces seen at the beginning of the kymograph. (b) A kymograph (with a duration of ca. 21 hrs) of the corresponding growth channel is depicted here. The yellow traces indicate the position of cell edges over time. Custom Matlab software was written and used to construct the kymograph from the bright-field images. The dotted black line in both (a) and (b) is drawn by hand and illustrates our ability to follow the spatial movement of a specific bacterium edge as function of time. The division occurrence of the mother cell at the bottom of the growth channel is highlighted by a green ellipse in both the montage as well as the kymograph. From the kymograph it is clear that the growth and division of a single mother cell at the far end of the growth channel can be quantified over multiple cell cycles. In this experiment we observe eight mother cell divisions.

