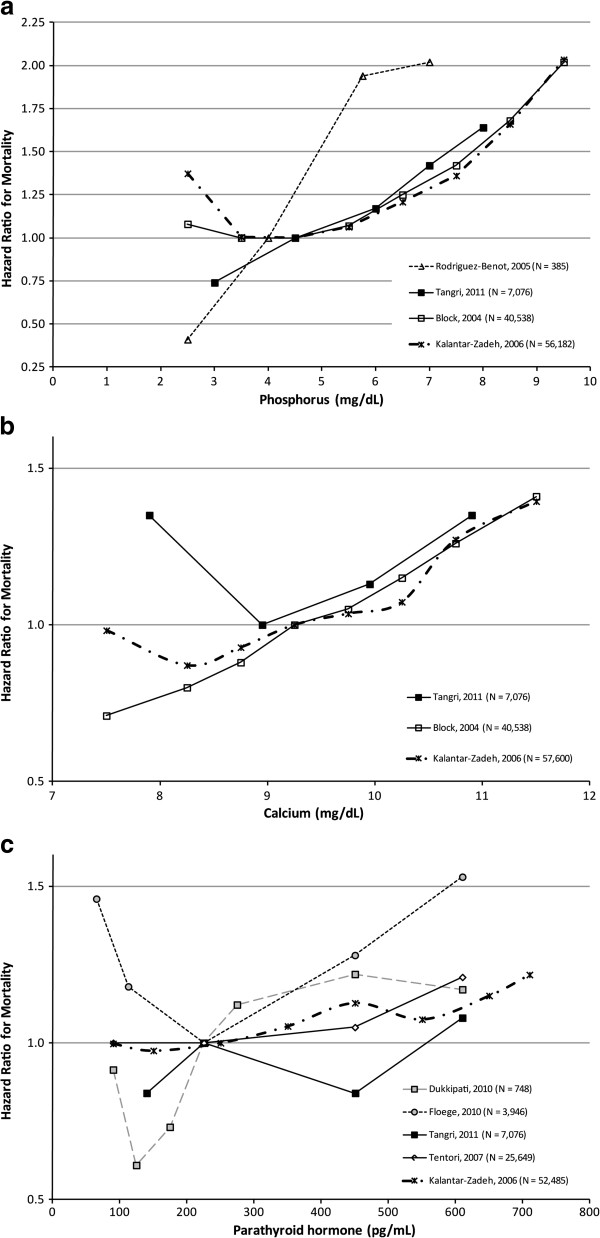
Figure 3.
Studies used in the meta-analysis of biochemical parameters and mortality. In these studies, biochemical parameter levels were analyzed as categorical variables. In order to visualize the relationship between mortality and the biochemical parameters, the values on the x-axis for each symbol in the figure represent the midpoint within each category for each study. In order to make the graphical representation more comparable across studies, we adjusted the HRs so that the midpoint of the reference range was as similar as possible. We stress that this is done just for the figures only and not for the meta-analyses. Specific adjustments are noted below.a. Phosphorus: The midpoints of reference ranges were ≈4- 4.5 mg/dL across all studies with the exception of Kalantar-Zadeh 2006 [14]. For this study, we adjusted the graphical depiction of the reference range from 5–6 mg/dL to 4–5 mg/dL. Of note, non-linear relationships were most clearly evident in the 2 studies with the largest sample sizes. b. Calcium: The midpoints of reference ranges were ≈9-9.25 mg/dL across all studies. No studies had to be adjusted for graphical display. c. PTH: The midpoints of reference ranges were ≈225-250 pg/mL across all studies with the exception of Dukkipati 2010 [29]. For this study, we adjusted the graphical depiction of the reference range from 300–600 pg/mL to 200–249 pg/mL.

