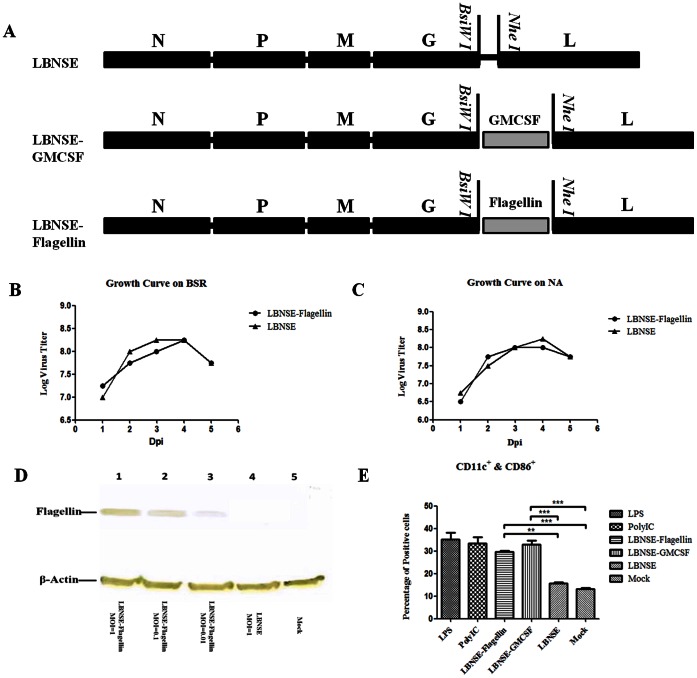
Figure 1. Construction and in vitro characterization of rRABV expressing flagellin.
Schematic diagram for the construction of rRABVs LBNSE, LBNSE-GMCSF, and LBNSE–Flagellin (A). The pLBNSE vector was constructed from SAD B19 by deleting the long non-coding region of the G gene and adding BsiWI and NheI sites between the G and L genes [30]. N, P, M,G and L represented RABV nucleoprotein, phosphoprotein, matrix protein, glycoprotein, and polymerase genes, respectively. Mouse GM-CSF [30] and bacterial flagellin genes were individually cloned between the G and L instead of thelong non-coding region of the G gene. Virus growth curves were determined on BSR cells (B) or NA cells (C). Cells were infected with either the LBNSE or LBNSE-Flagellin at a multiplicity of infection (MOI) of 0.01. The culture supernatants were harvested at 1,2,3, 4 and 5 dpi, and viral titers determined as described in Materials and Methods. All titrations were carried out in quadruplicate. The level of flagellin expression was determined by Western blotting analysis (D). NA cells were sham-infected, infected with LBNSE-Flagellin, (MOI = 1, 0.01, or 0.001), or LBNSE (MOI = 1) for 24 hrs, then cells were collected and lysed for Western blotting. The levels ofβ-Actin were assayed as a loading control. Activation of bone marrow-derived DCs by rRABV was determined (E), Bone marrow was harvested from BALB/c mice, and DC precursors were cultured with GM-CSF. The cells were infected with each of the rRABVs. The expression of DC activation markers (CD11c+and CD86+) was analyzed with flow cytometery. Both LPS and PolyI:C were used as positive controls, and the medium from untreated cells (Mock) was used as negative controls. Data are the means from three independent experiments. The horizontal lines represent the geometric mean for each group, and statistical analysis was performed by one-way ANOVA. (*,P<0.05;**,P<0.01;***,P<0.001).

