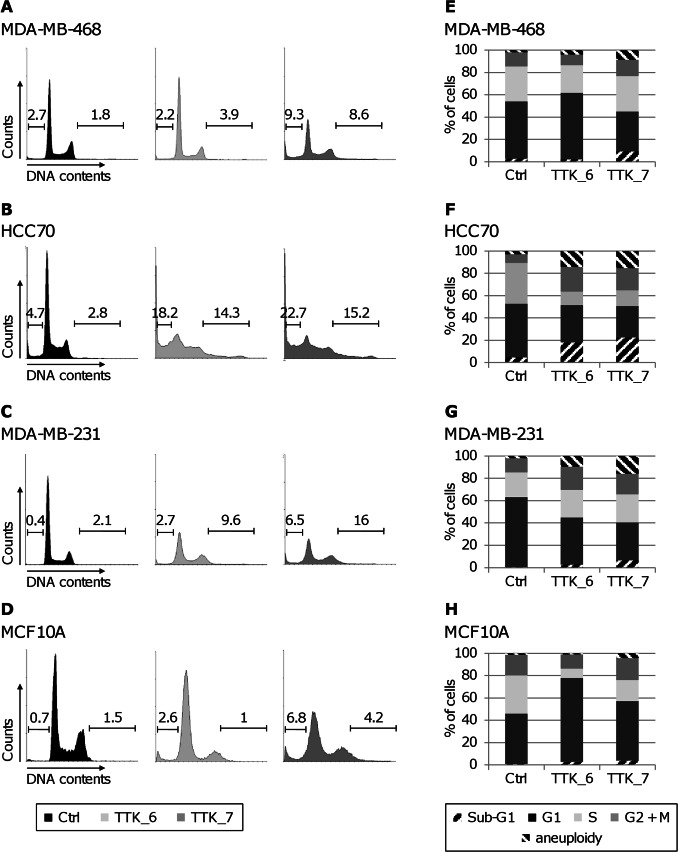
Figure 5. Depletion of TTK in triple-negative breast cancer cells affects cell cycle progression.
(A to D) Flow cytometry analysis of the cell cycle distribution after TTK depletion. We transfected TNBC cells, MDA-MB-468 (A), HCC70 (B) and MDA-MB-231 (C), and normal MCF10A cells (D) with the indicated siRNAs, as in Figure 4. We monitored the cell cycle status of siRNA-treated cells by flow cytometry analysis following propidium iodide (PI) staining, 120 h for TNBC cells and 72 h for normal cells after siRNA-transfection. We also indicated for each profiles the percentage of sub-G1 cells on the left bars and the percentage of aneuploid cells on the right bars. (E to H) Quantification of the cell cycle distribution after TTK depletion corresponding to the panels A to D for MDA-MB-468 (E), HCC70 (F), MDA-MB-231 (G), and MCF10A (H) cells, with the percentages of cells in sub-G1 phase (right dark hatched), G1 phase (dark gray), S phase (light greys), G2+ M phase (grey) and aneuploid population (left black hatched).

