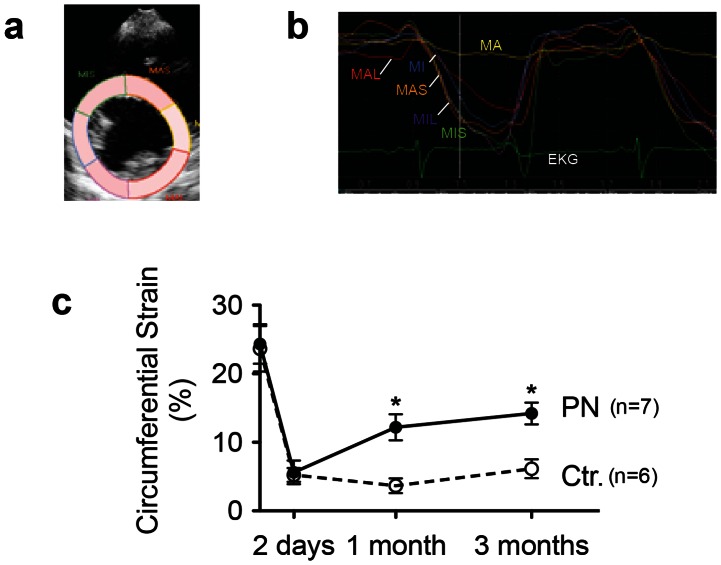
Figure 4. Periostin improves regional function.
Analysis of regional function by strain analysis. (a) Example of division of mid-ventricular short-axis image into six segments to determine regional strain. (b) Representative example of segmental circumferential strain before initiation of therapy shows lack of contractility in infarcted anterior segment (yellow line, designated A). (c) Strain analysis after combination of infarcted segments (MA+MAS) and non-infarcted segments (MIS+MI+ML+MAL). Ctr., control hearts receiving gelfoam with buffer (n = 6); PN, hearts receiving gelfoam with periostin peptide (n = 7). Statistical comparison between control and periostin peptide groups by t-test (a–e, * P<0.05), and two-way ANOVA.

