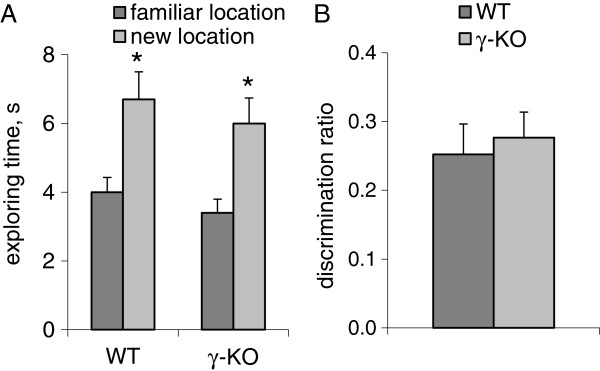
Figure 5.

Object location test. Bar charts show mean values+S.E.M (WT n=7, γ-КО n=8). A – the total exploring time of familiar and displaced object, s. B – the discrimination ratio which was calculated as described in the text. Asterisks indicate statistically significant differences between the access value within the group (* – p<0.05, Wilcoxon T-test).
