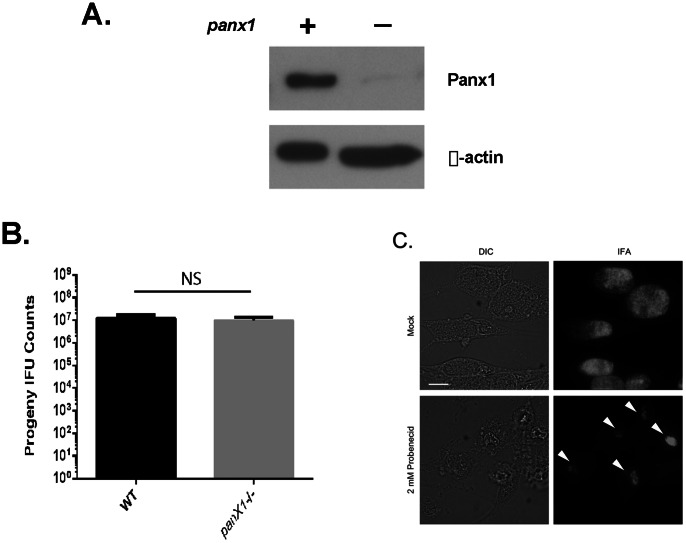
Figure 6. Growth of C. trachomatis in Panx1-deficient cells.
Panx1 levels in panx1−/− astrocytes were examined via immunoblot in comparison with panx1-expressing cells. Levels of β-actin were assessed as loading controls. (B) Astrocytes prepared from wild-type and panx1−/− mice were infected with C. trachomatis for 24 hr. Data for progeny counts are represented as mean ± standard deviation of duplicate samples. (C) panx1−/− astrocytes were infected with C. trachomatis and mock treated or treated with 2 mM probenecid. Inclusions were visualized by DIC or immunofluorescence staining 24 hr post infection. Bar = 5 µM.

