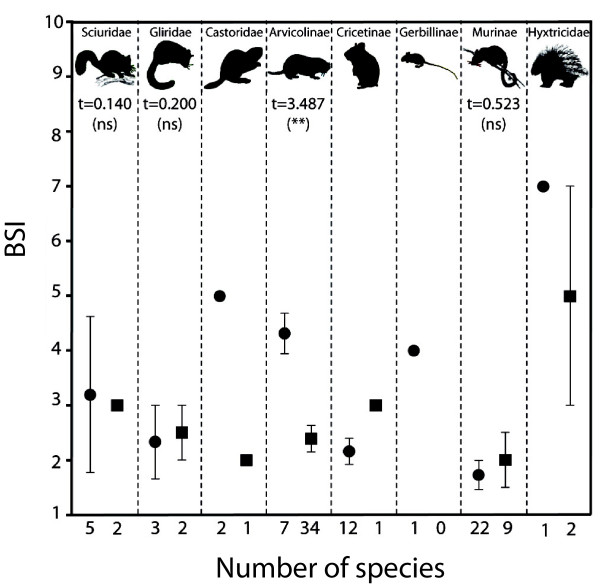
Figure 3.
Species BSI (average ± standard error) values for each rodent clade. Species BSI (average ± standard error) values for each rodent clade in the Plio-Pleistocene record from the Iberian Peninsula. Values before (circles) and after (squares) the onset of the modern northern hemisphere glaciations, 2.75 million years ago, are shown. T-student tests for both assemblages in each clade are indicated when statistical comparisons were possible. **, p < 0.01; ns, non significant. Taxonomic groups are ordered according to Wilson and Reeder [45].

