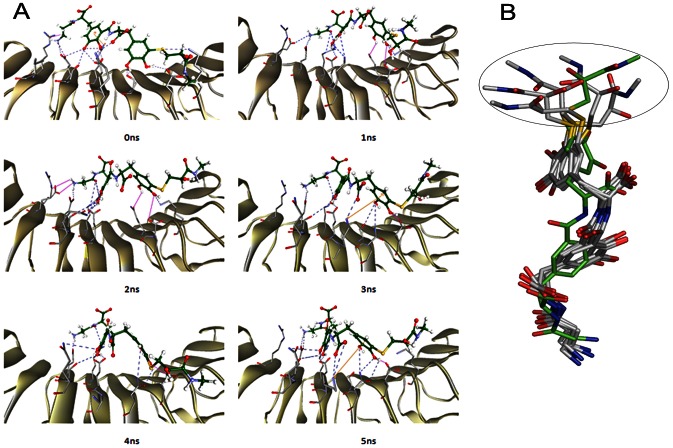
Figure 7. Snapshots of hFSHR-FSHP complex during the course of MD simulation.
(A) The binding mode and interactions of FSHP (green ball and sticks) with hFSHR (cartoon) shown at different time intervals. The hydrogen bonds, electrostatic and cation-π interactions are shown in blue, pink and orange lines respectively. (B) Molecular overlay of FSHP conformations taken at intervals of 1 ns. The conformation of FSHP taken at 0 ns is shown in green sticks. The region of FSHP that displays flexibility during the simulation is circled.

