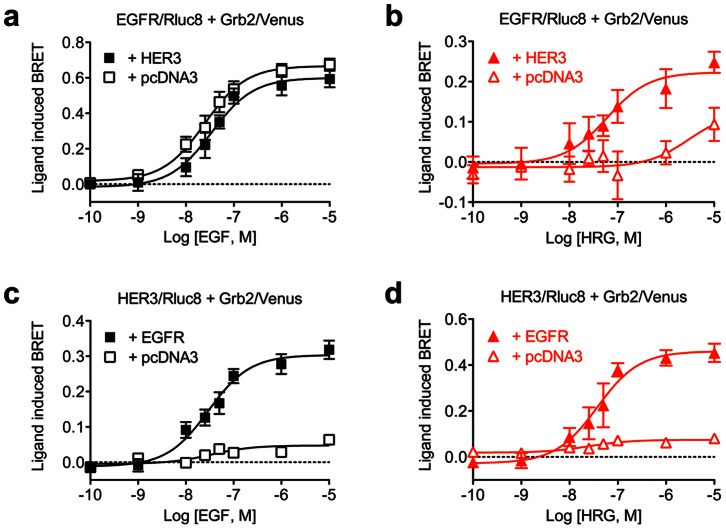
Figure 3. Dose-response analysis of EGF and HRG-induced recruitment of Grb2 to complexes containing EGFR and/or HER3.
HEK293FT cells expressing EGFR/Rluc8 and Grb2/Venus, with and without HER3, were treated with increasing concentrations of EGF (a) or HRG (b). Similarly, cells expressing HER3/Rluc8 and Grb2/Venus, with and without EGFR, were again treated with increasing concentrations of EGF (c) or HRG (d). BRET was measured in live cells before and after stimulation with the agonists as indicated, with the data shown generated after about 25 minutes of agonist stimulation. Data represent mean ± SEM of 3–9 independent experiments.

